SuperTrend on cTrader: Settings, Multi-Timeframe Reads, and When It Lies
How SuperTrend is built, what ATR period and multiplier really change, how to read one symbol across Weekly to M5, and the market conditions where the line stops being useful.
SuperTrend on cTrader: Settings, Multi-Timeframe Reads, and When It Lies
SuperTrend is one of those indicators people install in their first month and quietly keep for years. It's simple. One line, two colors, price is either above it or below it. That simplicity is the reason it survives, and it's also the reason people misuse it.
This post covers how the line is actually built, what the two main settings do to it, how to read it across several timeframes without opening a wall of charts, and the conditions where you should stop listening to it.
How the line is built
SuperTrend is a volatility band that only flips when price closes through it.
In its classic form you take the bar's midpoint (high plus low, divided by two), then add and subtract a multiple of ATR, the Average True Range. That gives you an upper band and a lower band. In an uptrend you only see the lower band, drawn under price. It's allowed to ratchet up as the market climbs, but it never moves down. In a downtrend it's the upper band, sitting above price and only allowed to move lower.
The flip happens when a bar closes on the other side of the active band. Then the line jumps to the opposite side and the color changes.
Two things fall out of that design:
- It trails. Each flip comes after the move has already started, never before it.
- It adapts. When volatility expands, ATR grows and the band sits further away, so normal noise is less likely to flip it.
Some versions also let you pick the source price and a moving-average type. Ours does. The core idea doesn't change: a band set some distance from price, with that distance measured in volatility, not pips.
What the settings actually change
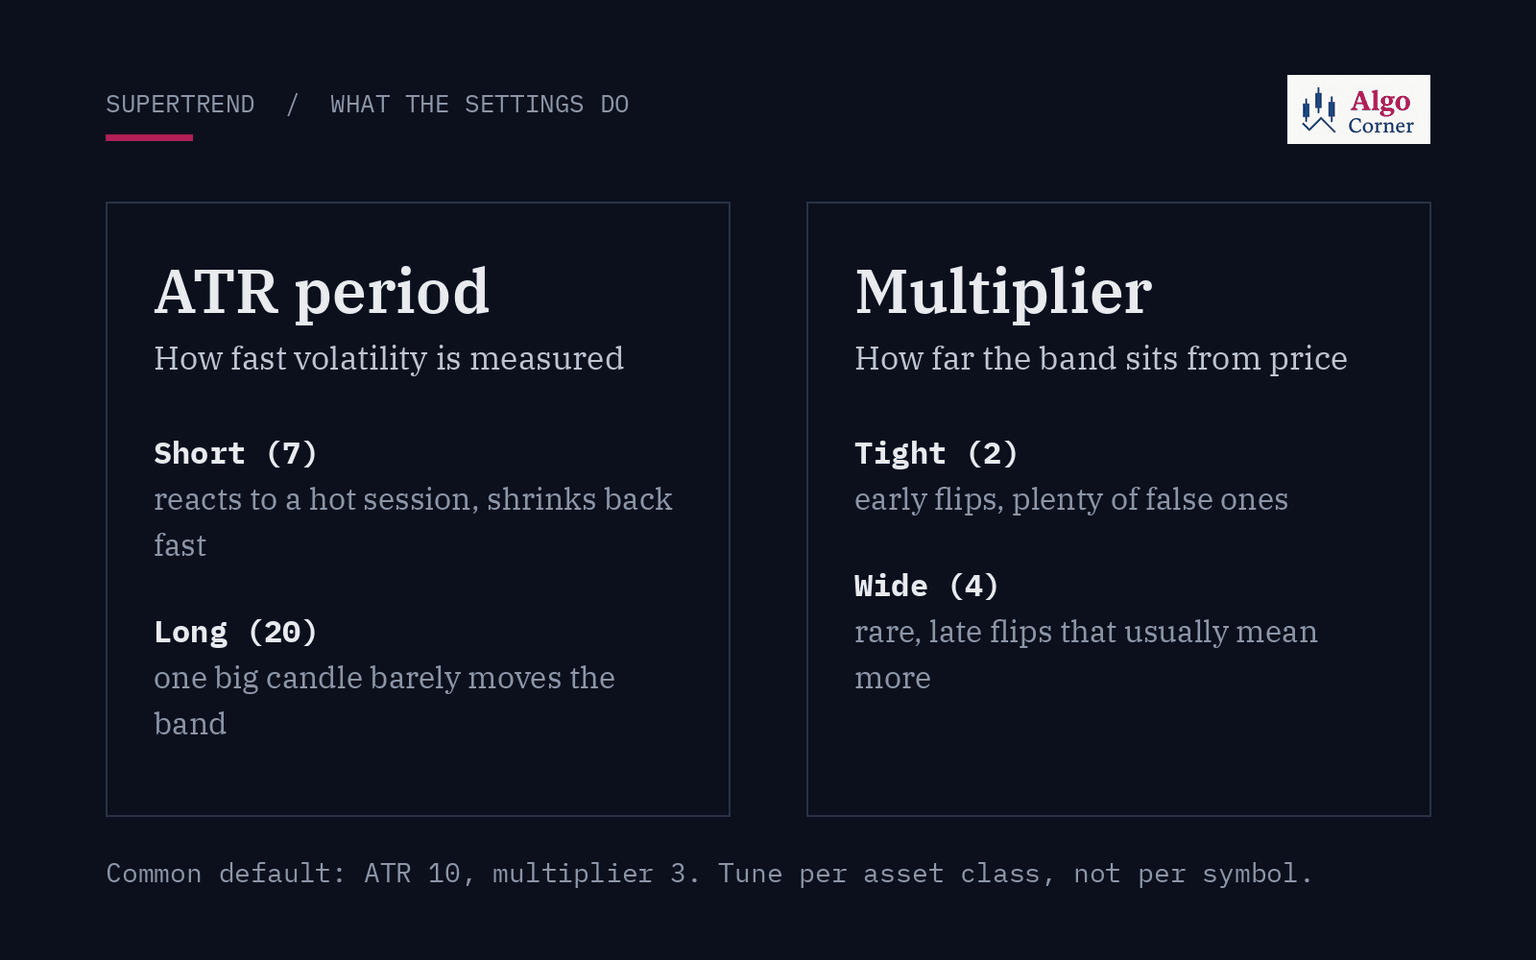
The common default is ATR period 10 with a multiplier of 3. It's a decent starting point. It isn't sacred.
ATR period controls how fast the volatility estimate reacts. A short period like 7 responds quickly to a volatile session and shrinks back just as fast. A long period like 20 smooths things out, so one big candle doesn't drag the band around very much.
Multiplier controls distance. This is the setting that matters most. At 2, the band hugs price and you get early flips plus plenty of false ones. At 4, flips are rare and late, though once one prints it usually means something.
A practical way to tune it: put the line on the timeframe you actually trade, scroll back through three or four months, and count the flips that reversed within two or three bars. If that's more than a third of them, the multiplier is too tight for that symbol. Gold and some of the yen crosses often need more room than EURUSD.
Don't tune separately for every symbol on your watchlist, though. You'll end up curve-fitting to last quarter. Pick settings per asset class and leave them alone.
Reading it across timeframes
One SuperTrend on one chart tells you very little. The same line on Weekly, Daily, H4, H1 and below tells you where you are inside the bigger move.
Here's a real panel from our SuperTrend Scanner on a cTrader Desktop demo account, Weekly through M5 across nine pairs:
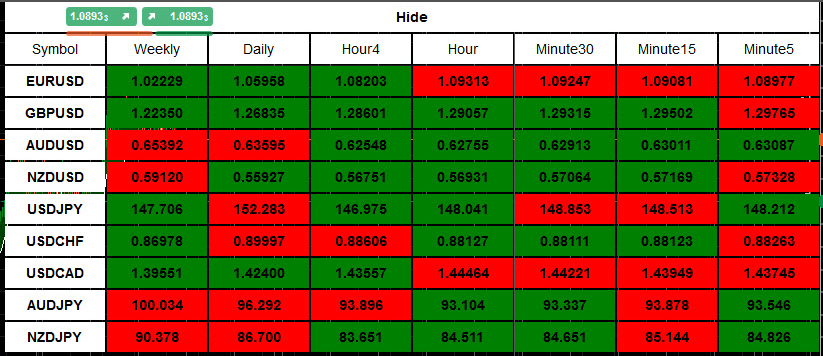
Look at the EURUSD row. Weekly, Daily and H4 are green. H1, M30, M15 and M5 are red. That's not a contradiction, it's a pullback inside an uptrend. If you trade with the higher timeframe, this is the part where you're waiting, not selling. The trigger you'd look for is the lower timeframes flipping back to green while H4 holds.
A rough way to split the columns:
- Weekly and Daily set the bias. If they disagree, size down or sit out.
- H4 and H1 tell you whether the current swing agrees with that bias.
- M15 and M5 are timing only. A flip down here is noise unless something above it has changed too.
A full row of one color looks great and is often late. By the time M5 through Weekly all agree, a lot of the move is behind you. The rows where the lower timeframes are turning back toward the higher ones are usually more interesting than the ones that are already uniform.
If you've read our post on Fair Value Gaps on cTrader, it's the same problem from a different angle. The information exists on every chart. The hard part is seeing all of it at once without flipping between twenty tabs.
When SuperTrend lies
The line is honest about one thing only: where price closed relative to a volatility band. In some conditions that tells you nothing useful.
Ranges. In a sideways market price crosses the band over and over. You'll see green, red, green, red on H1 for two days straight. Each flip looks like a signal and none of them pay. If the Daily is flat and H1 has flipped four times this week, the tool is telling you there's no trend. Believe it.
News spikes. A single NFP or CPI candle can close through the band and flip it, then price comes straight back. On lower timeframes, wait for the next close before you treat a flip around a release as real.
Thin sessions. Late Friday, holiday weeks, the hour around daily rollover. ATR shrinks, the band tightens, and small moves start flipping it.
After a big move. Once a trend has run hard, the band can sit far from price. If it flips late, you're often entering just as the move is tired. A flip that comes after an extended leg deserves more caution, not less.
None of this means SuperTrend is broken. It's a filter, not an entry system. Use it to decide which side you want to be on, then use your own rules to pick the spot.
A short routine before the session
- Load the symbols you actually trade. Not forty, maybe eight to twelve.
- Look at Weekly and Daily first. Write down a bias per symbol: long, short, or nothing.
- Drop any symbol where those two disagree.
- On what's left, find H4 or H1 pulling back against the bias. Those are your candidates.
- Set alerts for the lower timeframes flipping back. Then leave the chart alone until one fires.
It's ten minutes of work. Most of the value comes from step three, which is mostly a list of trades you won't take.
If you want the grid without the chart-hopping
You can do all of this by hand, opening each symbol and checking each timeframe. It works, it's just slow, and it's easy to skip pairs when the market gets busy.
That's why we built SuperTrend Scanner for cTrader Desktop. It puts your watchlist and timeframes into one panel, lets you click a cell to jump to that exact chart, and can alert you by sound, popup, email or Telegram when a cell flips. ATR period, multipliers and source are in the parameters, so you can match whatever settings you already trust. It's $19 on the cTrader Store, Desktop only (Windows and Mac).
Details are on the SuperTrend Scanner page.
Trade with the higher timeframe. Let the small ones tell you when.