RSI Across Timeframes on cTrader: Why 70/30 Isn't a Signal
What RSI actually measures, why overbought and oversold stop meaning much in a trend, which levels to use instead, and how to read one symbol from Weekly down to M1 without opening a wall of charts.
RSI Across Timeframes on cTrader: Why 70/30 Isn't a Signal
Most traders learn RSI as a rule: above 70 sell, below 30 buy. Then they watch a strong trend park RSI above 70 for three weeks while price keeps going. The indicator was fine. The rule was the problem.
This post is about using RSI the way it's actually useful. What the number measures, why the textbook levels break in trends, what to use instead, and how to read it across timeframes and symbols without flipping through twenty charts.
What the number measures
RSI compares the size of recent up closes to recent down closes. Over the lookback (14 bars by default, the setting Welles Wilder published in 1978), it averages the gains and the losses separately, takes the ratio, and squashes it onto a 0 to 100 scale.
So a reading of 65 doesn't mean "expensive." It means that over the last 14 bars, up closes have been bigger than down closes by a fair margin. That's momentum. Nothing more.
Two consequences:
- RSI says nothing about price level. EURUSD can be at a yearly high with RSI at 50 if it got there slowly.
- Strong trends produce high readings and hold them. That's what a strong trend is.
On cTrader the built-in RSI lets you change the period and the source. Shorter periods (7, 9) hit the extremes more often. Longer ones (21, 25) rarely leave the middle. Pick one per style and stick with it. Swapping periods until the chart agrees with you is curve-fitting with extra steps.
Why 70/30 fails, and what to use instead
In a range, 70 and 30 work tolerably. Price stretches, RSI stretches, both snap back.
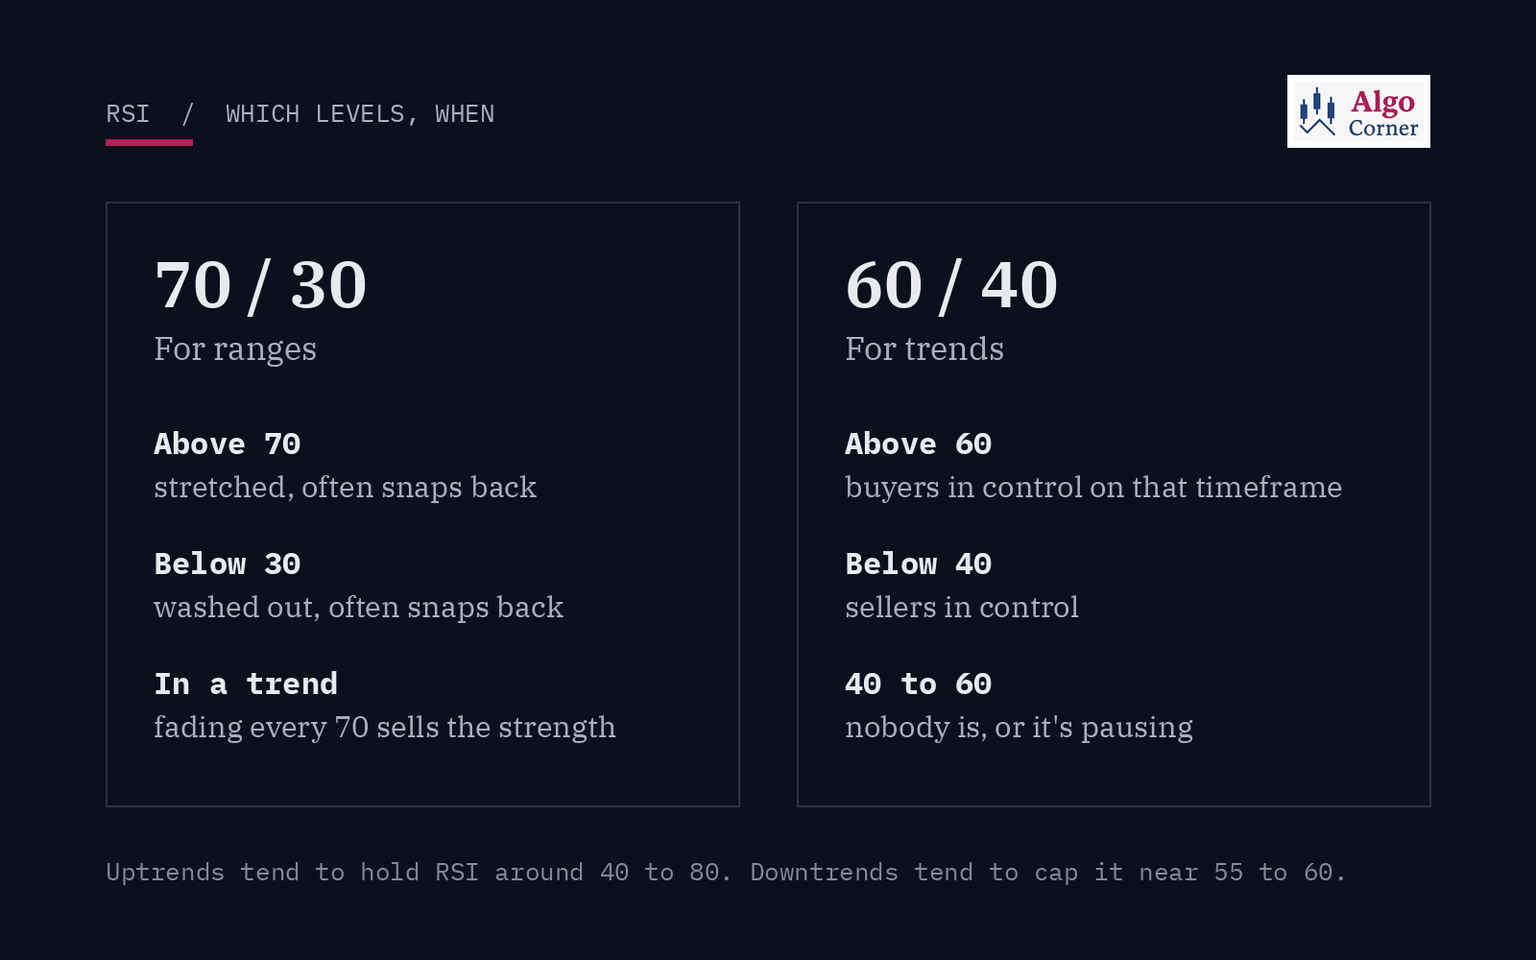
In a trend they don't. An uptrend will happily hold RSI between roughly 40 and 80 for months. A downtrend tends to cap it around 55 to 60 and push it toward 20. Fade every 70 in a bull market and you're selling the strength you should be buying.
A cleaner way to use the scale is as a momentum regime:
- Above 60: buyers are in control on that timeframe.
- Below 40: sellers are.
- 40 to 60: nobody is, or the market is pausing.
That's the setup in the panel below, with overbought at 60 and oversold at 40. It isn't a magic pair. It's just a narrower band that tells you who's pushing, instead of waiting for an extreme that may never print.
Reading one symbol across timeframes
One RSI on one chart is a mood. The same RSI on Weekly, Daily, H4 and below tells you where you are inside the bigger move.
Here's a real Oscillator Scanner panel on a cTrader Desktop demo account. RSI 14 on the close, green above 60, red below 40, ten pairs from Weekly to M1:
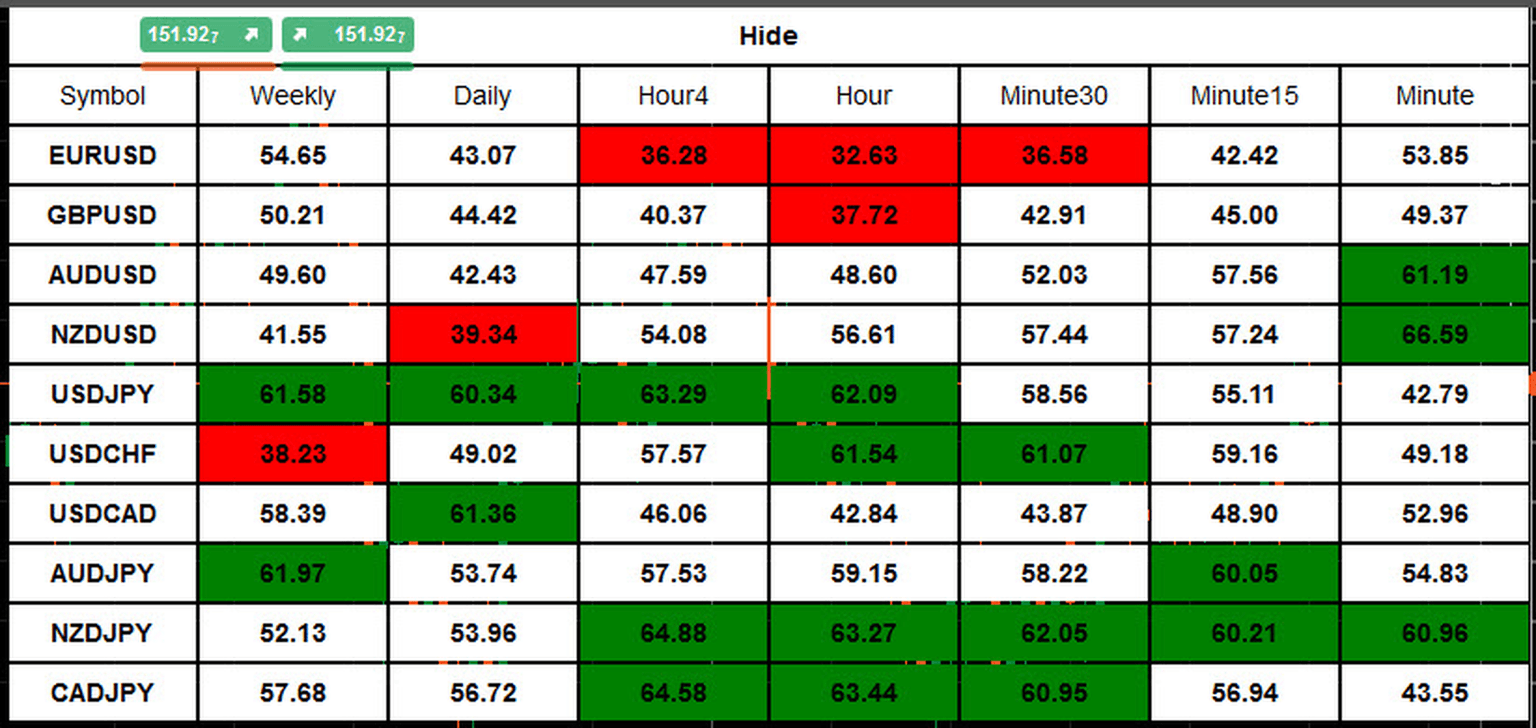
Start with rows. Each row is one symbol, top-down.
USDJPY: 61.58 Weekly, 60.34 Daily, 63.29 H4, 62.09 H1. Four green cells in a row, then M30 and M15 slipping back under 60 (58.56, 55.11). That's momentum aligned on every timeframe that matters, with the small ones taking a breath. If you trade with the trend, the cooling is the interesting part. You don't chase the green. You wait for the short timeframes to dip and then turn back up.
EURUSD: Weekly 54.65 and Daily 43.07, both neutral. Then H4, H1 and M30 all below 40. Sellers own the intraday swing, but the higher timeframes haven't picked a side. That's a short-term move inside a market with no real bias, which usually means smaller size and quicker targets.
USDCHF: Weekly 38.23, red. H1 and M30 above 61, green. The lower timeframes are bouncing against a weak weekly picture. Buying that bounce is a counter-trend trade, whatever the H1 looks like. Know which one you're taking.
Quick split for the columns:
- Weekly and Daily give the bias. If they disagree, there isn't one.
- H4 and H1 tell you whether the current swing agrees with it.
- M30 and below are for timing. A red M15 is noise unless something above it changed too.
Reading across symbols
Now read down the columns instead.
USDJPY, NZDJPY and CADJPY are all green on H4 and H1. AUDJPY is green on the Weekly. Four different charts, one story: yen weakness. That isn't four trade ideas. It's one idea with four tickets, and if you take all of them you've quadrupled a single bet on the yen.
This is the part that's almost impossible to see one chart at a time. You'd have to open each pair, check each timeframe, and remember what you saw on the first one by the time you reach the eighth.
If you've read our posts on SuperTrend across timeframes or Fair Value Gaps on cTrader, it's the same problem again. The data is already on every chart. The hard part is seeing all of it at once.
Where RSI misleads you
Divergence on its own. Price makes a higher high, RSI makes a lower one. It's a warning that momentum is fading, not a timing signal. Strong trends throw out three or four divergences before they actually turn.
News candles. A single CPI or NFP bar can shove H1 RSI from 45 to 72 in one close. Wait for the next bar or two before reading anything into it.
M1 and thin sessions. At the rollover or late on a Friday, a few ticks move the lower-timeframe readings around. Treat those columns as background unless the market is properly open.
Flat higher timeframes. If Weekly and Daily both sit near 50, the intraday extremes mostly revert. That's ranging behavior, and the old 70/30 logic works better there than anything above.
A five-minute check before the session
- Load the pairs you actually trade. Eight to twelve, not forty.
- Read Weekly and Daily. Write down long, short or nothing for each.
- Cross out anything where those two disagree.
- Read down the columns for clusters. Several pairs leaning on one currency count as one position.
- On what survives, look for H4 or H1 pulling back toward 50 against the bias. Those are your candidates. Set alerts and stop staring.
Step three cuts most of the list. That's the point.
If you'd rather not open forty charts
You can do every step above by hand. It just takes a while, and the first thing to go when the market gets busy is the cross-check.
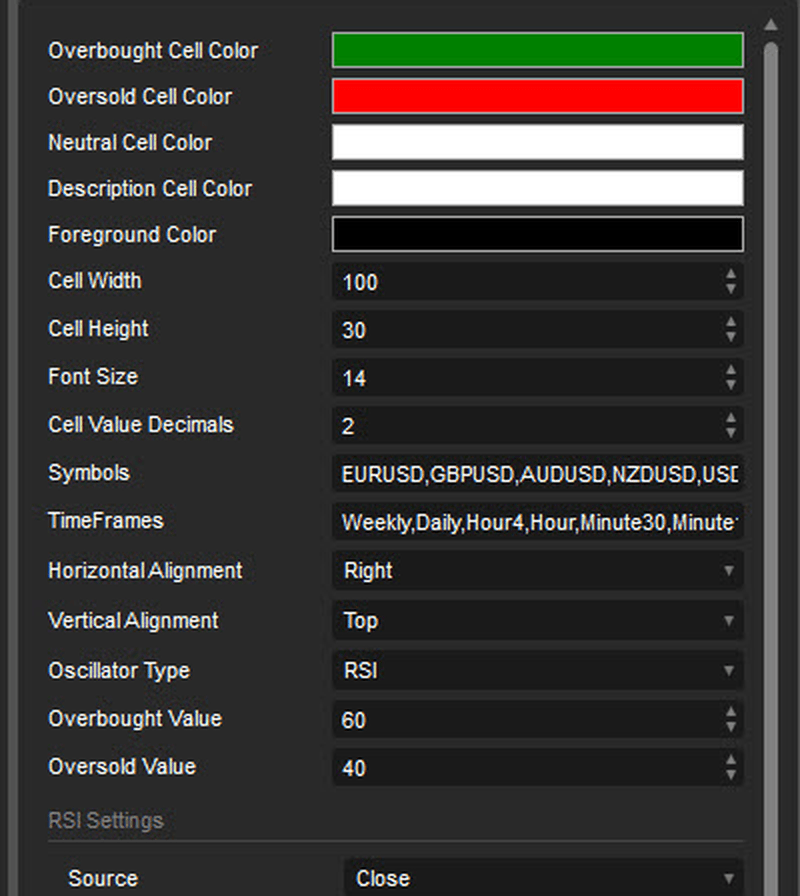
That's what we built Oscillator Scanner for. It puts your symbols and timeframes into one panel for cTrader Desktop, colors each cell when a reading crosses your overbought or oversold level, and lets you click any cell to switch to that chart. RSI is one of 13 oscillators it can run, along with Stochastic, MACD, CCI, DeMarker and others. The levels are yours to set, so 60/40, 70/30 or anything else works. It can alert you by sound, message box or Telegram when a cell crosses.
There's a free trial on the cTrader Store. Details are on the Oscillator Scanner page.
Read the higher timeframes for direction. Use the lower ones to wait.